Before thinking about how we tune a controller (i.e. adjust the controller parameters to produce an optimal controlled response) we need to decide what constitutes a good response. This turns out not to be an easy question to answer! There are, in fact, many different measures which can be used to compare the quality of controlled responses.
The term 'academic' is not intended to be pejorative (especially since I am one!). The control measures describe in this section are very precise and give exact comparisons between different control schemes, or different sets of tuning parameters, and are widely used in academic journal papers and simulation studies. They are also completely useless for measuring the performance of real control systems.
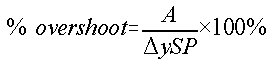
The three commonly used measures are Integral Squared Error (ISE), Integral Absolute Error (IAE) and Integral Time-weighted Absolute Error (ITAE), and are defined as:
All the measures require a fixed experiment to be performed on the system (i.e. a fixed setpoint or disturbance change) and the integrals are evaluated over a fixed time period (in theory to infinity, but usually until a time long enough for the responses to settle).
ISE integrates the square of the error over time. ISE will penalise large errors more than smaller ones (since the square of a large error will be much bigger). Control systems specified to minimise ISE will tend to eliminate large errors quickly, but will tolerate small errors persisting for a long period of time. Often this leads to fast responses, but with considerable, low amplitude, oscillation.
IAE integrates the absolute error over time. It doesn't add weight to any of the errors in a systems response. It tends to produce slower response than ISE optimal systems, but usually with less sustained oscillation.
ITAE integrates the absolute error multiplied by the time over time. What this does is to weight errors which exist after a long time much more heavily than those at the start of the response. ITAE tuning produces systems which settle much more quickly than the other two tuning methods. The downside of this is that ITAE tuning also produces systems with sluggish initial response (necessary to avoid sustained oscillation).
A VisSim model with a PI controlled tuned to optimise each of the three measures can be found here.
The reason that the three measures can't be used in practical system comparisons is that they require a carefully controlled experiment, where only a particular parameter is changed in a predefined way. Although it may sometimes be possible to perform experiments on real plant, it is impossible to stop random disturbances affecting the process during an experiment. The random disturbances will affect the process output and hence alter the integrated error measures in an unrepeatable way.
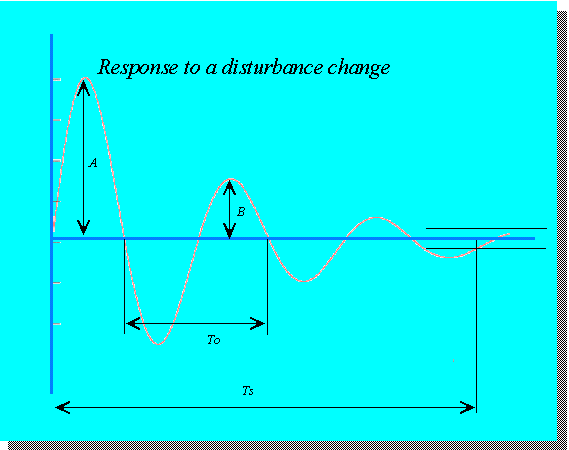
The performance measures described in this section are not nearly so precise as IAE, ISE or ITAE, but have the advantage that they are easy to apply to real systems. Some measures can only be applied to controlled responses to setpoint changes (in real systems, setpoint changes are much easier to make than disturbance changes - by their nature disturbances can't usually be manipulated).
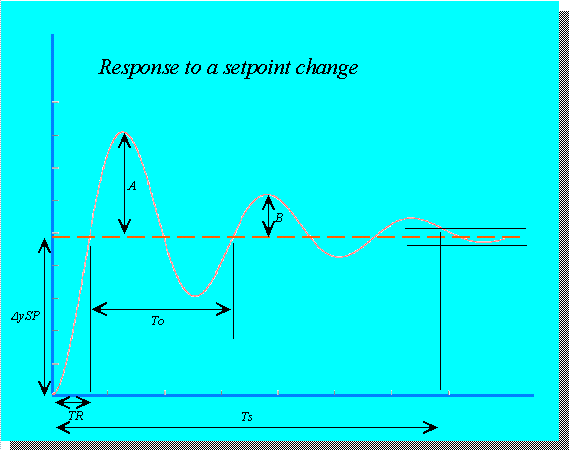
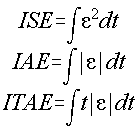
The percentage overshoot is, in linear systems, independent of the size of the setpoint change (for small changes it is almost independent in non-linear systems). Large overshoots are undesirable and percentage overshoots exceeding 100% probably indicate instability.
The most widely used measure of practical control performance is the decay ratio as it gives a good indication of the stability of the controlled response. An often used rule for controller tuning is 'one-quarter decay ratio', where the controller is tuned to produce a decay ratio of 1/4 (the second peak is a quarter the height of the first).